(The life and times of me keeping up with the things that should be constant in a sea of variables...)

Project | 01
News Influenced Disease Prediction (Link)
This was some of the most interesting research I was involved in with the PhD department of NYU . The key or the train of thought we began this research was, in the most theatrical description, "a way to detect or foresee diseases before they happened and take necessary preventive steps".
We essentially used models and techniques such as the Susceptible, Infected and Recovered (SIR) Model, Granger Causality etc.
The data sources were quite vast, ranging from a few TB of data from most noticeably GDELT, World Health Organization(WHO) Disease Outbreak News etc. (Code on Github)
Project | 02
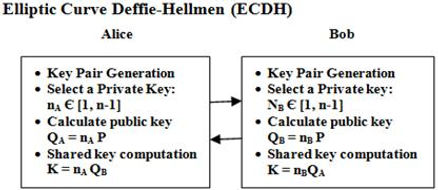
Speed/Security Trade-off for IoT devices using ECDH Algorithm. (Link)
This project was targeted towards the field of IoT devices. Since there is an expected speed at which they have to process commands or requests or voice interactions, there happens to exist a compromise on the security aspect of things to provide for speed. While the current existing algorithms do try to combat that, they are computationally heavy, which the onboard processors of IoT devices may not always handle well.
Here we introduce a way to sacrifice a minor amount of the performance of the device for a much better improved secure experience.
Project | 03

Impact on Weather on the Public Transportation of NYC (Link)
(Note- My team and I are in the process of publishing a paper in the ICAIS 2019 Conference )
We all know that rain, snowfall, storms lead to the first decision being to stay indoors. But for those who don't have that choice and have to venture out in NYC, the question is raised as to how they choose to travel in those adverse or regular conditions.
We primarily use Data Analytic Tools(such as MapReduce, Hive and Spark) and Visualizations(Tableau) to help us spot trends or anomalies in the data given a certain date, time and weather condition.
For this we used the NYC Subway turnstile data, Uber and YellowCab data and Weather data.
Project | 04
Shopping Cart System Built from Agile Tools and Techniques (Link)
This was a project that I had worked on that involved building a Shopping Cart System, and the team had to work in an Agile setting, ie., having a Scrum Master, A product manager, having short and quick updates and releases, have the ability for quick rollbacks to previous versions if the updates failed etc.
Some of the tools that were implemented were Vagrant as a container enviroment for dev, Travis CI/CD, Bluemix Pipelines for deploying the app, codecoverage tool for testing the passed/failed cases, feature and step files. We also ran unit tests and BDD.

Others
Some of the other projects that I have worked on are -
* Optimal Uber Pick-ups using Predictive Modelling - Essentially using a regression algorithm to determine the best route for an Uber to take to get the most pick-ups. We analyze the Uber Data along with weather and locations acquired from tweets to get the tourist trending locations based in NYC. (LINK)
* Time Series analysis of Bus Routes to predict posterior speeds - Here we used the Bus data for NYC buses to get their speeds on each sector. The speeds are listed for each day and for each time segment.
We assessed the data to be an AR or MA model, check the number of delays, differentiating it to make it stationary, and run the model respectively to get a prediction. (LINK)